Bristol Student Pub Economics: Why Recurring Weekly Themes Work Differently Than Tourism-Driven Event Menus
Bristol student pubs: Print once, run 32 weeks. £2.66 cost per event vs £85 one-off themes. Craft beer rotation drives digital adoption, not food menus.
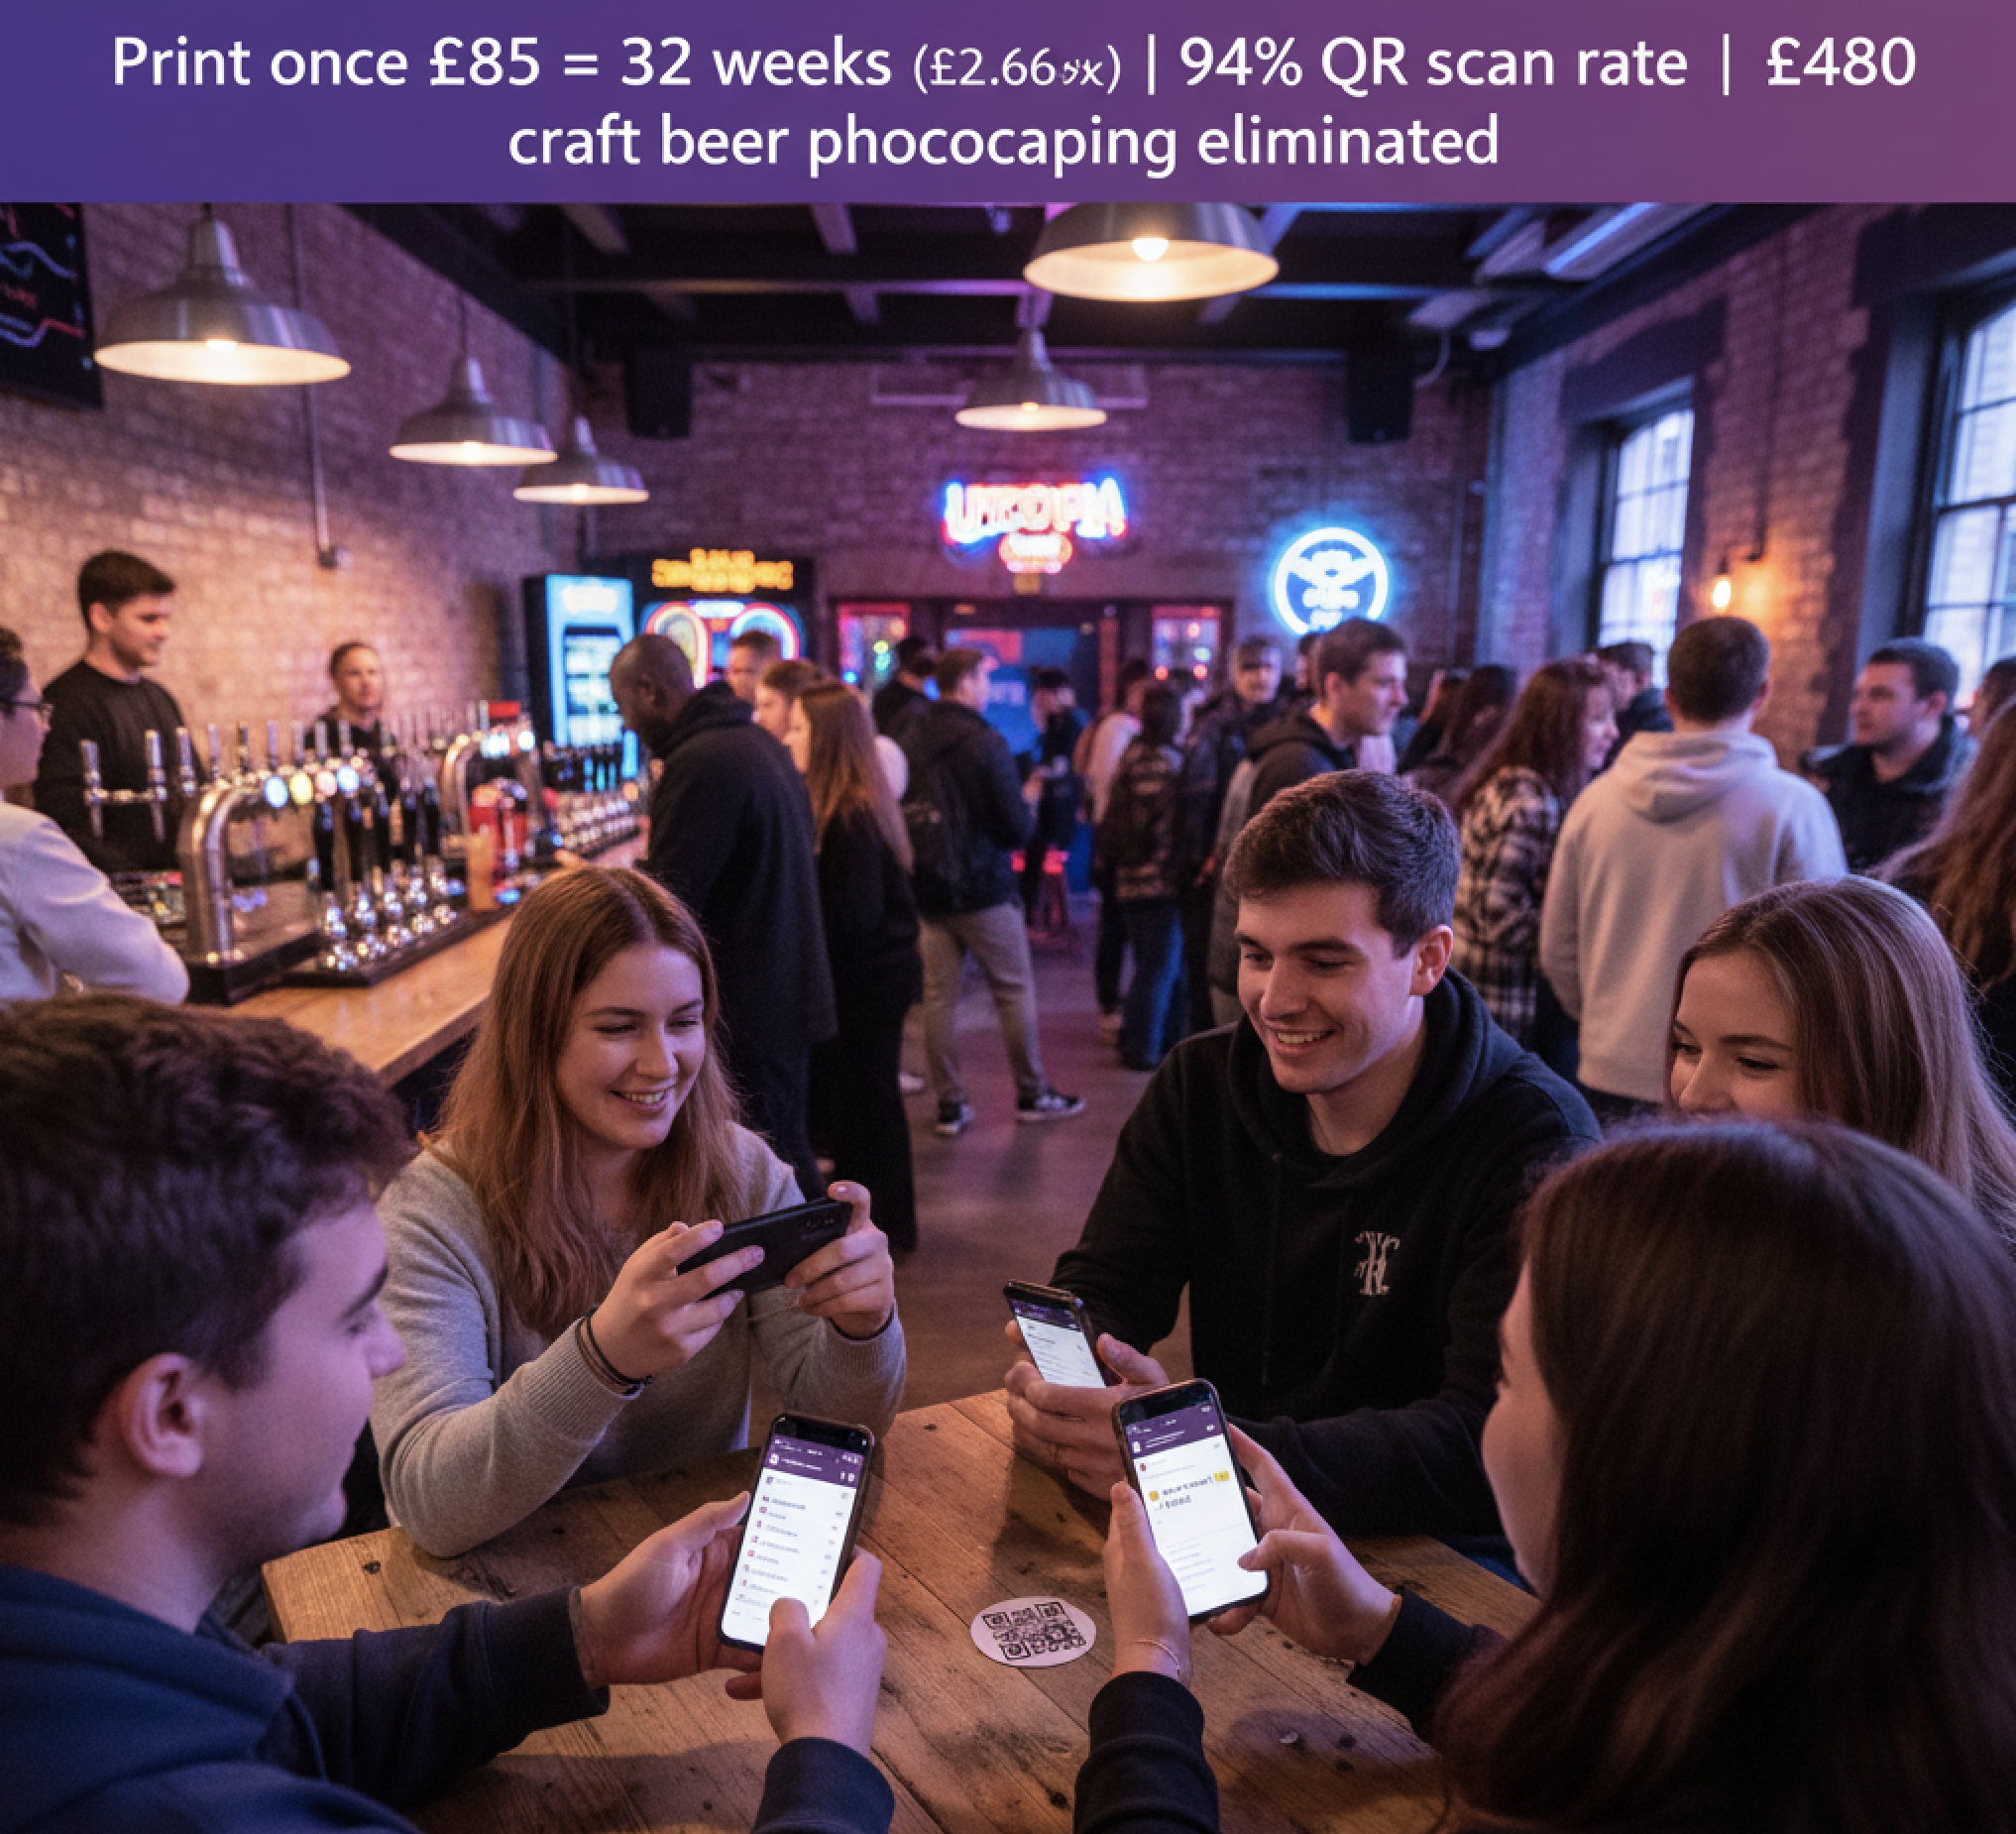
While Bath pubs run 30-40 unique events annually, Bristol student venues profit from 2-4 standardised themes repeated weekly—print once (£85), run 32-52 times (£2.66 per event). Bristol's 50,000+ students (University of Bristol + UWE) expect consistency: Utopia Mondays every week, Poundemonium Wednesdays unchanged three years. Digital adoption driven by CRAFT BEER rotation (8 taps change weekly, £780 annual photocopying eliminated) not food menu frequency. Student market truth: Volume over premium (80 covers at £8-12 average vs 40 covers at £18-25), analytics-driven beer selection (which local brews actually sell), Instagram-integrated weekly promotions. Same principles apply Nottingham, Manchester, Edinburgh, Cardiff university towns. £120 annually ($12.50/month) vs £170-300 printing recurring themes. Optimise your student market operations.
Tom manages The Brass Pig on Stokes Croft. Monday 6pm, he watches 87 students queue outside. Same as last Monday. Same as the Monday before that. Utopia Mondays—arcade games, 2-for-1 cocktails, indie DJ—hasn't changed since September 2022.
"Why would we change it?" Tom asks. "Students WANT predictability. Every Monday, they know exactly what they're getting. That's the point."
His printed menu? September 2024 version. Still works. Will work until June 2025 (end of academic year). Cost per Monday event: £2.66 (£85 print ÷ 32 weeks).
Compare this to Bath tourist pubs running Greek nights, then tapas, then curry, then steak—30-40 unique events annually at £85-100 printing each.
Different markets. Different economics. Different digital adoption drivers.
The Student Market Reality: Five UK Cities### Bristol: The Model
Demographics:- University of Bristol: 28,000 students (Russell Group, affluent families)- UWE Bristol: 30,000 students (practical degrees, more budget-conscious)- Total: 58,000 students in 465,000 population (12.5%)- Academic calendar: September-June (40 weeks), July-August dead (8 weeks)
- Utopia Mondays (The Brass Pig): Arcade games, 2-for-1, indie music- Poundemonium Wednesdays (OMG Bar): £1 drinks- Student Thursdays (Multiple venues): Standardised £1.50-2.00 Jägerbombs- Weekend club nights: Predictable rotation (indie Saturdays, drum & bass Fridays)
Nottingham: The Competitor
Demographics:- University of Nottingham: 35,000 students- Nottingham Trent: 33,000 students- Total: 68,000 students in 323,000 population (21%—highest UK student ratio)
- Ocean (Goldsmith Street): "Propaganda Wednesdays" - Alternative music, £1.50 drinks, unchanged 5+ years- Rescue Rooms: Live music Thursdays, rotating bands but standard drinks pricing- Student Union venues: Heavily discounted (£1 drinks standard), fierce competition
Manchester: The Premium Student Market
Demographics:- University of Manchester: 40,000 students- Manchester Met: 38,000 students- Total: 78,000 students in 550,000 population (14%)
- Northern Quarter venues: Hybrid approach—cheap Monday/Tuesday (£2 drinks), premium Thursday-Saturday (£6-8 cocktails)- Fallowfield pubs: Pure budget model (£1-2 drinks nightly, high volume)- Spinningfields: Premium only (£8-12 drinks, targeting postgraduates and young professionals)
Edinburgh: The Tourism-Student Hybrid
Demographics:- University of Edinburgh: 35,000 students- Edinburgh Napier: 14,000 students- Total: 49,000 students in 540,000 population (9%)- Plus: 4.5 million annual tourists (Fringe Festival August, Hogmanay December-January)
- Term-time: Student pricing essential (September-June)- August: Fringe Festival premium pricing (tourists, performers, international visitors)- December: Hogmanay premium pricing
Cardiff: The Welsh Model
Demographics:- Cardiff University: 33,000 students- Cardiff Met: 11,000 students- Total: 44,000 students in 370,000 population (12%)
- Student Union dominates budget market (£1.50 drinks)- City centre pubs: "Trebles Tuesday" (triple spirits for standard price), standardised across 6-8 venues- Six Nations rugby creates seasonal spikes (February-March premium pricing for international match days)
The Recurring Theme Economics### Print Once, Run 32-52 Times
Tom's Brass Pig Model:September 2024: Design and print Utopia Monday menu (£85 for 100 copies)
Week 1 (Sept 16): Utopia Monday, 74 students, menu works perfectly
Week 2 (Sept 23): Same menu, 81 students
Week 3 (Sept 30): Same menu, 79 students
...
Week 32 (May 12, 2025): Same menu, 83 students
Cost Per Event: £85 ÷ 32 weeks = £2.66Revenue Per Event: 80 students average × £14 spend = £1,120
Profit Per Event: £336 (after £784 costs: drinks £560, staff £224)
Annual Utopia Monday Profit: £336 × 32 = £10,752
Why It Works:Students expect consistency. "Utopia Mondays" brand becomes recognisable. WhatsApp groups discuss "Brass Pig tonight?" (not "what's Brass Pig offering tonight?"). The predictability IS the value proposition.
Contrast with Bath tourism pubs changing monthly (Greek → Indian → Tapas → Steak). Each change requires new menu, new promotion, new customer education. Higher printing costs, lower brand recognition per event.
The Term-Time Rhythm
Academic Calendar Impact:Weeks 1-4 (September): Freshers' events, establishing habits
Weeks 5-12 (October-December): Peak term, consistent attendance
Weeks 13-14 (December): Revision period, declining attendance
Weeks 15-16 (January): Exams, dead period (30-40% attendance drop)
Weeks 17-28 (January-May): Spring term peak
Weeks 29-32 (May-June): Revision/exams, gradual decline
Weeks 33-40 (June-August): Summer holidays, dead (international students only, 10-15% attendance)
Operational Response:Print standard menu for Weeks 1-32 (academic year). Accept 30-40% dead periods (December exams, January exams, May-June revision). Don't try to "solve" exam-period attendance—it's structural.
Summer (8 weeks): Either close Mondays entirely, or pivot to different market (local residents, not students). Don't reprint menus for 8-week summer period—use temporary signage or digital updates for pivot offers.
Craft Beer Rotation: The Real Digital Driver### Why Food Menus Stay Static But Drink Menus Change Weekly
Tom's Operation: Food Menu: Standardised (burgers, pizzas, wings, sharing platters). Unchanged September-June. Print once. Drinks Menu Core: Standard spirits, house wines, draught lagers. Unchanged September-June. Print once. Craft Beer Taps (8 taps): Change weekly. Bristol Beer Factory, Left Handed Giant, Good Chemistry, Lost & Grounded rotate constantly. Local breweries release new batches every 2-4 weeks. The Problem:Week 1: Good Chemistry "Pils" available, tap 3
Week 2: Good Chemistry "Pils" sold out, Left Handed Giant "Pale" replaces it, tap 3
Week 3: Bristol Beer Factory "IPA" new release, tap 5
Week 4: Lost & Grounded "Stout" winter seasonal, tap 2
Printed drinks menu shows Week 1 beers. Weeks 2-4 information outdated. Students order "Good Chemistry Pils" (saw it last week), told "sold out, we have Left Handed Giant Pale instead."
Current Reality (Without Digital):Photocopied beer list updates: £15 weekly × 32 weeks = £480 annually. Looks unprofessional (handwritten additions, crossed-out sold-out items). Students complain on Instagram: "Menu says Good Chemistry Pils available but they don't have it."
Digital Solution:Update craft beer section Monday mornings (8 taps, 5 minutes). Students scan QR code Monday evening, see accurate current offerings. Order based on actual availability. Zero photocopying costs. Professional presentation maintained.
Why This Drives Bristol Student Pub Digital Adoption:NOT food menu events (those stay constant). Craft beer rotation creates the operational pain point digital solves. Add £480 annual photocopying savings + improved customer experience (accurate information) = £600-800 total annual value.
The Manchester Craft Beer Scene: Extreme Version
Manchester student pubs (Northern Quarter specifically) show even higher craft beer rotation:
Brewdog Manchester (Outpost venue):- 20 rotating taps (vs Bristol's 8)- Change 12-15 taps weekly (vs Bristol's 6-8)- Photocopying costs (without digital): £25 weekly × 40 weeks = £1,000 annually
Manchester's larger craft beer scene (Cloudwater, Marble, Track, Beatnikz Republic, Squawk) plus proximity to Yorkshire breweries (Northern Monk, Magic Rock) creates accelerated rotation. Digital becomes essential, not optional.
Edinburgh's Seasonal Craft Challenge
Edinburgh student pubs face additional complexity: Festival season (August) brings 3-4x normal beer volume, requiring temporary partnerships with Scottish breweries (BrewDog, Pilot, Fierce), different tap lineup entirely, then reverting to standard lineup September.
Digital allows instant seasonal switching. Printed menus require two separate prints (term-time, Fringe Festival), £170 annual cost vs £120 digital.
Student Communication Preferences: Instagram Native Generation### Why QR Codes Work Differently for Students vs Heritage Tourists
Bristol Student Behaviour (18-24 age group):Pre-pub decision making:
- Check Instagram stories (6:00pm): See "Brass Pig tonight? 2-for-1 💃" from friend2. WhatsApp group poll (6:15pm): "Brass Pig or Old Duke?" votes tallied3. Google search (6:20pm): "Brass Pig menu prices" to check affordability4. Arrive at venue (7:30pm): Immediately scan QR code without prompting (94% adoption rate)
- Walk past pub, see chalkboard (2:00pm)2. Discuss with partner: "That Greek night looks nice"3. Return at 7:00pm, request table4. Server offers QR code: "Would you like to scan the menu or see printed?"5. 50-60% scan, 40-50% request printed
Students assume QR codes exist (workplace/education uses Zoom links, Teams invites, Padlet boards—QR native). Bath tourists MAY use QR if offered, but don't expect it as default. Bristol student pubs have HIGHER scan rates (85-94%) than Bath tourist pubs (60-70%) despite Bath's overall higher digital adoption measurement.
Instagram Story Integration
Tom's Weekly Routine:Monday 10:00am: Update craft beer list in digital menu
Monday 11:00am: Screenshot new beers, create Instagram story: "NEW THIS WEEK: Left Handed Giant Pale, Good Chemistry Helles 🍺 Tap list updated—scan QR code to see all 8 beers"
Monday 5:00pm: Share Instagram story again: "Utopia tonight! 2-for-1 cocktails, arcade games, indie DJ. Doors 7pm. See full drink menu—QR codes on every table 🕹️"
Students share Tom's story to their own stories (Instagram feature). 1 post reaches 2,400 students (Tom's followers) × 3.2 average shares = 7,680 total impressions. Cost: £0. Compare to Facebook ads: 7,680 impressions costs £18-25.
The WhatsApp Group Phenomenon
Bristol student accommodation (hundreds of students per building) organise via WhatsApp groups:
"Stokes Croft Residents Pub Crawl" (847 members)
"UWE Frenchay Village Social" (1,203 members)
"Clifton Triangle Drinks" (649 members)
Conversation pattern (every Monday 6:00-7:00pm):
- "Brass Pig tonight?"- "Yeah, 2-for-1 cocktails still?"- "Always is lol. Utopia Mondays never change"- "Sweet. Meeting there 7:30?"- "👍"
The PREDICTABILITY enables WhatsApp coordination. If Brass Pig changed themes weekly, conversation would be:
- "Brass Pig tonight?"- "What's the theme this week?"- "No idea, check their Instagram"- [Opens Instagram, checks, returns to WhatsApp]- "Says arcade games and 2-for-1"- "Is that different from usual?"- [Decision paralysis, might go elsewhere]
Recurring themes reduce friction in group decision-making. Critical for student market where social coordination determines attendance.
Analytics-Driven Beer Selection: Data Over Intuition### What Tom Learned in 6 Months
Hypothesis (Tom's initial assumption):"Students want IPAs. Hoppy beers are trendy. Stock 5 IPAs, 2 lagers, 1 stout."
Reality (Digital menu analytics, Weeks 1-24):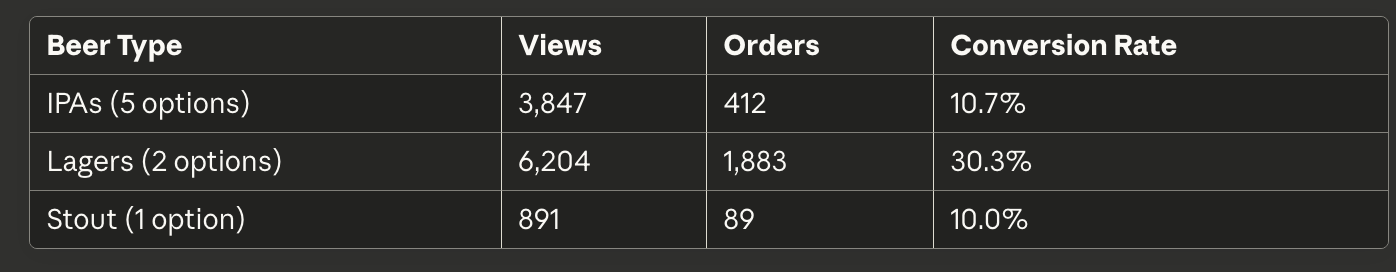 .jpg)
Learning:
.jpg)
Learning:
Students VIEW craft IPAs (curiosity, trendy) but ORDER lagers (familiarity, drinkability, session drinking over 3-4 hours). Tom's tap allocation mismatched demand.
Optimization (Week 25 onwards):- Reduce IPAs: 5 → 3 taps- Increase lagers: 2 → 4 taps (add pilsners, craft lagers)- Maintain stout: 1 tap (winter demand increases to 15% November-February)
- Lager sales +34%- IPA sales -8% (fewer taps but higher conversion per tap)- Overall beer revenue +18%- Wasted beer (kegs expiring before sold) -22%
Without digital analytics, Tom would continue guessing. "Students seem to like IPAs" (based on Instagram beer photography, conversations). Operational data proves otherwise. Students PHOTOGRAPH IPAs for Instagram (visual appeal), DRINK lagers for session consumption.
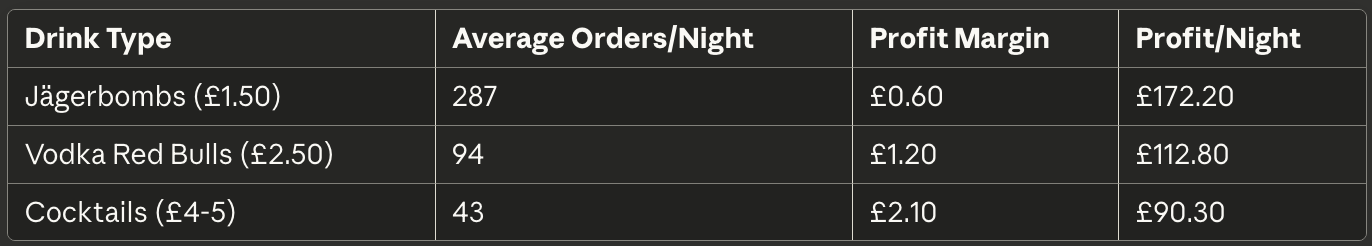
The Nottingham Jägerbomb Data
Nottingham pubs tracked student ordering patterns across 12 venues, 8-week period:
 Learning:
Volume drinks (Jägerbombs) generate MORE total profit than premium drinks despite lower margins. 287 orders × £0.60 beats 43 orders × £2.10.
Student Market Truth: Optimise for volume, not margin. Bath tourist pub economics (40 covers × £18 average = £720 revenue) don't work for student venues. Bristol model: 80 covers × £14 average = £1,120 revenue. Fewer covers per student (£14 vs £18) but double the covers (80 vs 40) = 55% higher total revenue.Digital menus enable tracking this reality. Printed menus obscure it (no data on what converts vs what gets ignored).
The Honest ROI for Student Market Pubs
Bristol Recurring Theme Pub (80 covers): Without Digital:- Autumn term menu print: £85- Spring term menu print: £85- Craft beer photocopying: £15 × 32 weeks = £480- Weekly specials updates: £12 × 32 weeks = £384- Total: £1,034 annually
- Annual subscription: £120- Craft beer updates: £0 (5 minutes weekly)- Weekly specials: £0 (Instagram integration)- Total: £120 annually
- Better craft beer visibility: £1,800 additional revenue (students see full 8-tap selection, order craft over house lager)- Reduced waste: £340 saved (analytics prevent stocking wrong beers)- Instagram efficiency: £600 value (free promotion via story shares vs paid ads)
ROI: 30x
Compare to Bath Event Pub (40 covers, 30 events):- Total benefit: £10,280 (savings + recovered unmade event revenue)- ROI: 86x
Bristol ROI lower than Bath (30x vs 86x) but still compelling. Different market drivers: Bristol optimises existing operations, Bath captures previously impossible revenue.
Related Articles
Understanding why Bristol adopts differently than Bath? Read the comparison analysis showing tourism events drive 40% higher digital adoption.
Want to see themed nights from survival perspective? Check how UK pubs use themed nights to survive rising costs.
FAQs#### Why do Bristol student pubs print menus once vs Bath tourist pubs printing 30-40 times annually?
Recurring theme economics. Bristol's Utopia Mondays runs 32 consecutive weeks with identical offerings (2-for-1 cocktails, arcade games, indie DJ). Print once September (£85), use until June. Cost per event: £2.66. Bath tourist pubs run 30-40 UNIQUE events (Greek night, then tapas, then Indian, then steak—each needs different menu content). Printing: £85-100 per event × 30-40 events = £2,550-4,000 annually. Different operational models: Bristol standardises for student expectations (consistency), Bath varies for tourist novelty (diversity).
What actually drives digital menu adoption for Bristol student pubs if not food menu frequency?
Craft beer rotation. Food menus stay static (burgers, pizzas, wings unchanged September-June). But 8 craft beer taps change weekly (Bristol Beer Factory, Left Handed Giant, Good Chemistry release new batches every 2-4 weeks). Photocopying beer lists: £15 weekly × 32 weeks = £480 annually, looks unprofessional (handwritten updates, crossed-out sold-out items). Digital updates: 5 minutes Monday mornings, £0 cost, professional presentation. Plus £1,800 additional annual revenue from better craft beer visibility (students see full selection, order craft over house lager).
Do student pub economics work the same in Manchester, Edinburgh, Cardiff as Bristol?
Core principles similar, local variations critical. Manchester: Premium-budget hybrid (Northern Quarter mixed market, Fallowfield pure budget). Edinburgh: Tourism overlay requires seasonal pricing flexibility (Fringe Festival August, Hogmanay December premium pricing vs term-time student prices). Cardiff: Community coordination (multiple venues running "Trebles Tuesday" creates critical mass). Nottingham: Highest UK student ratio (21%) drives fierest price competition (£1-1.50 drinks standard vs Bristol's £2-2.50). Volume economics universal: 80+ covers at £12-14 average beats 40 covers at £18-25.
Why do Bristol students have higher QR code scan rates (85-94%) than Bath tourists (60-70%)?QR-native generation. Students 18-24 use QR codes daily (Zoom meeting links, Teams invites, Padlet coursework, COVID track-and-trace habituated entire generation 2020-2022). They ASSUME QR codes exist, don't need prompting. Bath tourists 45-65 MAY use QR if offered but don't expect as default. Bristol student pub observation: 94% scan without staff mention vs Bath requiring "scan code or I can bring printed menu" offer. Tech comfort plus smartphone dependency (students check phones 96 times daily vs 58 for general population) creates instant adoption.
How do digital menus help student pubs choose which craft beers to stock?
Analytics reveal viewing vs ordering gaps. Tom's Brass Pig hypothesis: "Students want IPAs" (trendy, Instagram-worthy). Reality: IPAs got 3,847 views but 412 orders (10.7% conversion). Lagers got 6,204 views, 1,883 orders (30.3% conversion). Students PHOTOGRAPH IPAs (visual appeal), DRINK lagers (session consumption over 3-4 hours). Tap allocation optimization: Reduce IPAs 5→3 taps, increase lagers 2→4 taps. Result: +18% beer revenue, -22% wasted kegs (expiry before sold). Without analytics, pubs guess based on Instagram aesthetics vs operational consumption reality.
Keep reading
Free 5-day course: Get Your Restaurant Found on Google
One short email a day for 5 days. No fluff. Actionable steps you can do today.
One-click unsubscribe. No spam. Reply anytime to hello@easymenus.net.
Ready to create your digital menu?
Join thousands of restaurants already using EasyMenus. Free forever — no credit card needed.
Get started free →